
KanawatTH
Introduction
On June 29, the Federal Reserve released the results of the Dodd-Frank Act Stress Tests 2023, and the good news is that all 23 banks (8 Category I banks, 1 Category II bank, 10 Category III banks, and 4 Category IV banks) have adequate loss-absorbing capacity and remain able to lend under severe stress conditions. However, upon closer examination, the results were rather mixed for some.
My followers and regular readers know that I turned bullish on Truist Financial Corporation (NYSE:TFC) and U.S. Bancorp (NYSE:USB) in April after the two stocks fell sharply in the wake of the Silicon Valley Bank collapse and subsequent events. Both have significant unrealized losses in their held-to-maturity – HTM – investment portfolios and are therefore considered particularly vulnerable to bank runs. In my comparative follow-up analysis, I took a closer look at their investment portfolios to see if the true extent of their losses had been hidden.
Truist and U.S. Bancorp were among the weaker banks according to the stress test results, at least at first glance. In this update, I discuss the parameters of the severely adverse stress scenario and evaluate the test results for Truist and U.S. Bancorp, and conclude whether I still think TFC and USB stock are a buy after the 2023 stress tests.
2023 Federal Reserve Stress Test
Explanation Of The Severely Adverse Scenario, Why It Deserves Its Name, And Why Bank Runs Are Not Included
The primary objective of the Federal Reserve’s stress tests is to ensure that large U.S. banks have sufficient loss-absorbing capacity and are able to continue lending during an economic downturn. Recessions are typically accompanied by liquidity crises that negatively impact banks’ ability to lend to households and businesses for a variety of reasons, making it critical for the Federal Reserve to create “realistic” scenarios. Granted, the danger is in the things we don’t know today (e.g., the COVID-19 pandemic, as a recent example), so stress scenarios always are backward-looking. However, the fact that we cannot anticipate unknown risks does not mean that stress test results are meaningless. In my view, the Federal Reserve’s stress tests adequately account for known risks. Following the release of the stress test results, I think the Federal Reserve’s Vice Chairman for Supervision put it quite well:
At the same time, this stress test is only one way to measure that strength. We should remain humble about how risks can arise and continue our work to ensure that banks are resilient to a range of economic scenarios, market shocks, and other stresses.
Michael Barr, Vice Chair for Supervision of the Federal Reserve
Of course, as the recent past has shown, a bank run is one such known risk. However, it’s critical to understand that nationwide bank runs are not a baseline expectation for a stress scenario. Banks operate on the basis of a fractional reserve system, the Achilles Heel of which is, of course, bank runs. After all, the Federal Deposit Insurance Corporation (FDIC) can only cover a little over 1% of insured deposits. Trust is an integral part of the banking system, as I explained in my first article on banks in general and Truist Financial in particular. Also, don’t forget that the stress tests under the Dodd-Frank Act are largely capital related. In my opinion, it makes no sense to dismiss the Federal Reserve’s stress tests as meaningless simply because they do not include a scenario for a nationwide bank run. However, having worked in bank risk management myself (for a bank in Europe), I know that bank runs are included in liquidity stress tests. Banks include baseline deposit levels in their liquidity management models, and the stress scenarios take into account significant deposit outflows. Banks (have to) monitor their liquidity regularly, including in stress scenarios, using various metrics such as the liquidity coverage ratio – LCR. Those wishing to delve deeper should consult the relevant publication from the Bank for International Settlements on the LCR and liquidity risk monitoring tools.
Let me briefly explain the Federal Reserve’s most severe scenario and why I think it’s rightly called “severe.” The details of the scenario were announced in February 2023 and are tougher than previous model parameters. Compared to last year’s scenario, the decline in interest rates is more severe (interest rates are significantly higher compared to last year). The unemployment rate is increased more aggressively than before, and the modeled decline in real estate prices has become more pronounced. On the other hand, the impact on equity markets and bond spreads is less severe than previously, largely due to the 2022 bear market. However, as will be shown, the effects are still significant. But one thing after another:
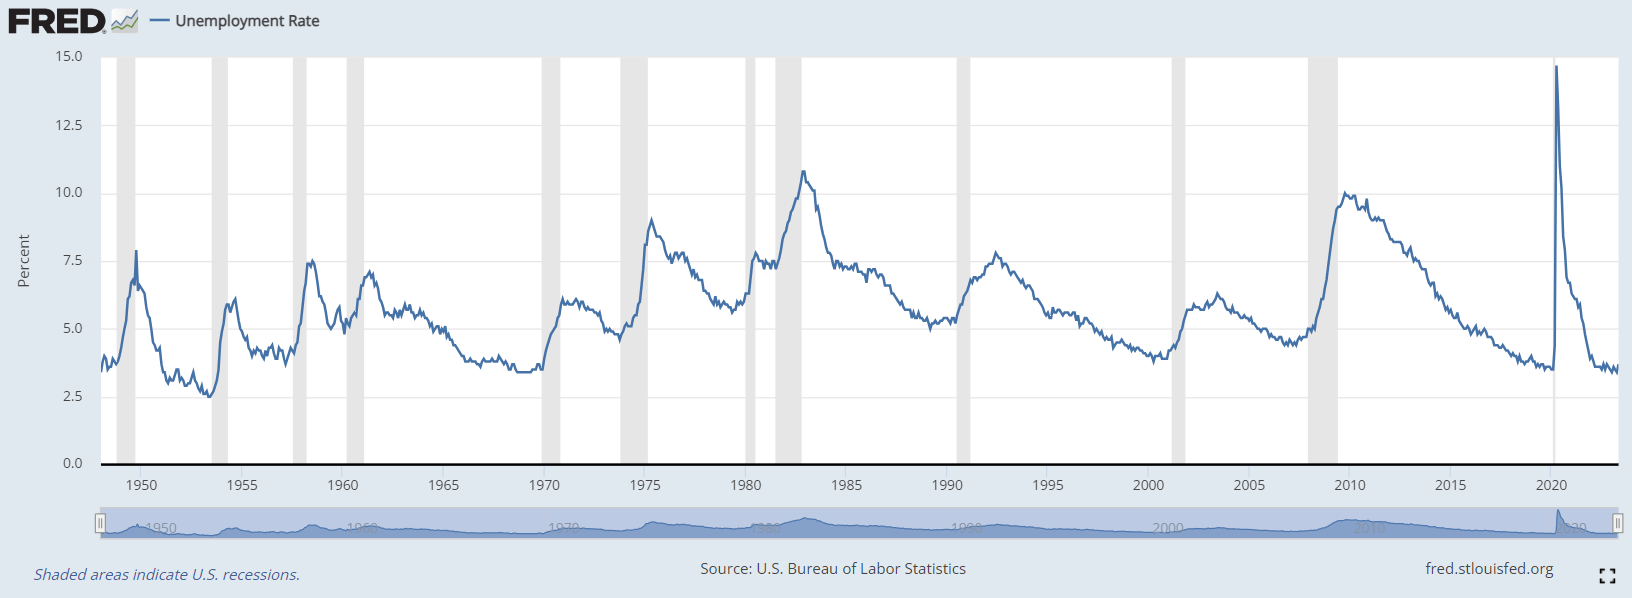
Over the course of seven quarters, the U.S. unemployment rate reaches 10% (at or above the peak of 1948 to 2022 recessions, except COVID-19, Figure 1), while the real gross domestic product (GDP) declines 8.75 percentage points from the year-end 2022 level in just over a year.
Figure 1: U.S. unemployment rate [UNRATE], U.S. Bureau of Labor Statistics (retrieved from FRED, Federal Reserve Bank of St. Louis)
Due to rising unemployment, the weak real estate market, the slowdown in economic activity and the resulting poor sentiment, consumer spending is declining and inflationary pressures are easing. The Federal Reserve uses a quarterly change in the consumer price index at an annual rate and projects a 2 percentage point decline to 1.25% over about nine months before recovering to above 1.5%.
To stimulate economic activity, short-term interest rates are cut to near zero within about nine months, while long-term rates fall by 3.25 percentage points within six months, based on the 2022 year-end yield of the 10-year Treasury. Since the inverted yield curve persists for two quarters, banks “theoretically” lose money when they engage in maturity transformation – one of the three pillars of bank profitability (see this article). “Theoretically,” because we have to keep in mind that banks are still paying relatively low interest rates on their deposits, so maturity transformation is currently a positive contributor to net interest income.
Of course, a severe stress scenario would not be complete if it did not also incorporate a significant negative impact on corporate bond markets. In the Fed’s severely adverse scenario, the spread between the lowest investment-grade bonds (BBB-) and 10-year Treasuries widened to 575 basis points over three quarters before narrowing again. This has a negative impact on the ability of companies to service their debt (floating rate debt and refinanced fixed coupon debt) and thus leads to an increasing number of defaults. The spread on mortgage rates rises to 300 basis points over the same period.
The Fed projects a 45% drop in stock prices within a year, and the volatility index (VIX) peaks at 75 within two quarters. This has a significant impact on the investment portfolios of banks and asset managers, whose risk management still relies heavily on volatility-based methods such as value-at-risk ((VaR)), which encourages procyclical behavior (selling at low levels) and thus further exacerbates the situation. This is one reason why I avoid investing in actively managed funds that use such risk management strategies.
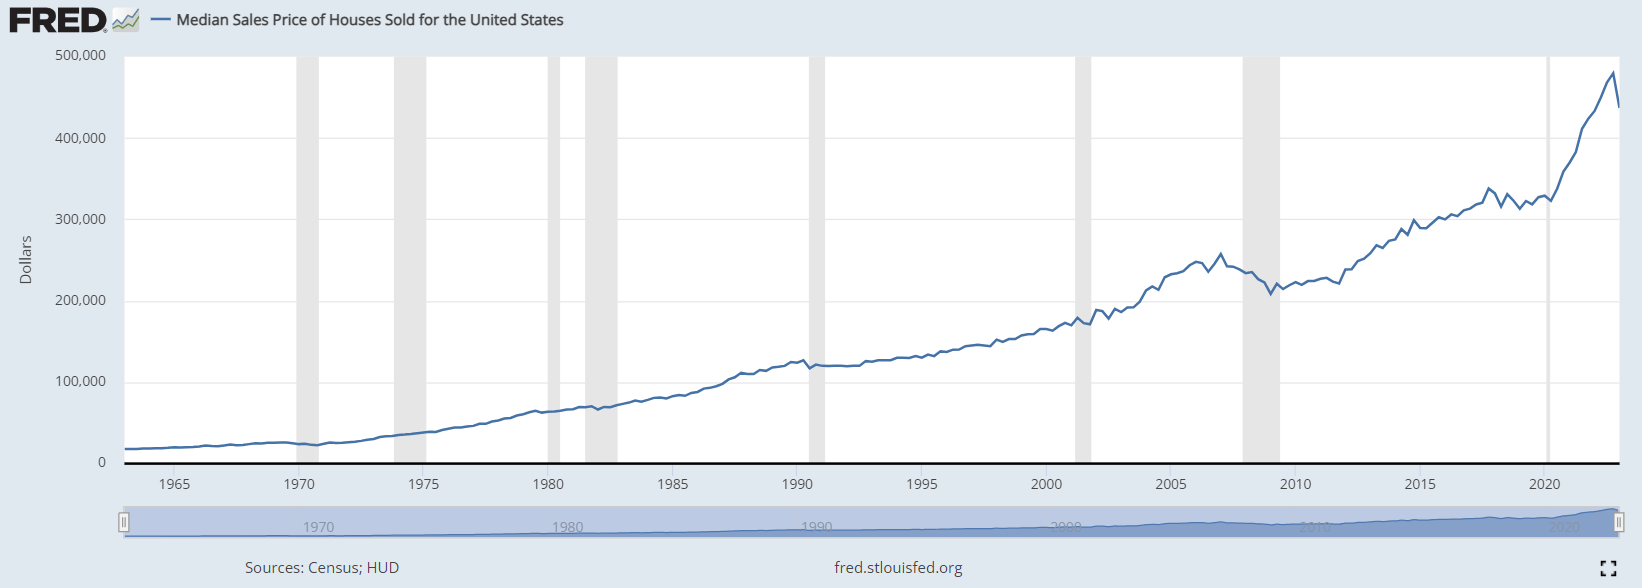
Home prices fall 38% over seven quarters, which would equate to a median price of less than $300,000, or the 2015 level, according to Figure 2. Commercial real estate will be hit slightly harder.
Figure 2: Median Sales Price of Houses Sold for the U.S. [MSPUS], U.S. Census Bureau and U.S. Department of Housing and Urban Development (retrieved from FRED, Federal Reserve Bank of St. Louis)
Due to the more or less large global exposure of the so-called “G-SIBs” (global systemically important banks, e.g., JP Morgan Chase (JPM), Bank of America (BAC), Citigroup (C), Goldman Sachs, (GS) and the interconnectedness of financial markets, the Fed includes recessions in all foreign economies in the model. As an aside, the stress tests of banks with large trading operations include a component for global market shocks. These banks – Truist and U.S. Bancorp – do not fall into this category. They’re also tested against counterparty default.
The scenario models a severe recession in Japan, the eurozone, and the United Kingdom, while the economies of developing Asia experience only a moderate recession and recover more quickly. The stress scenario includes a deflation scenario for all foreign economies, with a focus on Asian economies. From a currency perspective and based on historical data, the U.S. dollar appreciates against most major foreign currencies, which has a deflationary effect on the U.S. due to cheaper imports. At the same time, a rising U.S. dollar makes domestically-produced and exported goods less affordable for foreign trading partners and thus has a negative impact on economic activity in the U.S.
How Truist and U.S. Bancorp Fared Under The 2023 Stress Tests
First, it’s important to understand that the loss-absorbing capacity of banks, as measured by the common equity tier 1 (CET1) ratio, improved significantly since the Great Recession of 2008/09 due to several changes in the regulatory framework. Overall, the CET1 ratios of the 23 banks surveyed are more than twice as high as in 2009. At the peak of the severely adverse stress scenario, CET1 ratios fell from a starting level of 13.0% to a median of 10.1%, still well above the minimum ratio of 4.5%.
The median tier 1 leverage ratio decreased by 1.9 percentage points to 6.6%, also well above the regulatory minimum of 4.0%. As an aside, most investors (myself included) view the leverage ratio as a metric where a higher value means more pronounced leverage. A bank’s tier 1 leverage is calculated by dividing its core capital by total assets – so a smaller value means higher leverage.
Truist and U.S. Bancorp are both Category III banks, as they are domestic banks (not G-SIBs) and have total assets of less than $700 billion. At the end of 2022, TFC and USB had total assets of $555 billion and $675 billion, respectively. As an aside, with USB on the verge of becoming a Category II bank, one reason for the fairly favorable valuation is investors’ cautious stance due to the associated regulatory capital requirements and the (in my view unlikely) potential for a capital increase.
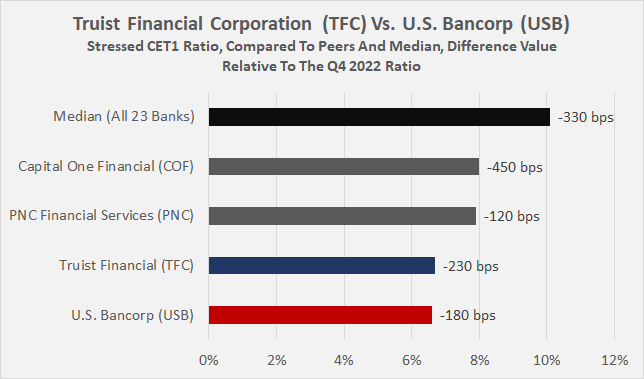
The decline in Truist’s and U.S. Bancorp’s stressed CET1 ratio looks rather poorly compared to the median (-230 and -180 basis points, respectively, Figure 3), and USB saw its ratio drop to the second lowest in the group, surpassed only by Citizens Financial Group (CFG) with a stressed CET1 ratio of 6.4%.
However, when considered in the context of a more or less comparable peer group (PNC Financial Services (PNC), Capital One Financial (COF)), they did not perform so badly and are still well above the regulatory minimum. Looking at the decline in CET1 from an actual year-end 2022 perspective, U.S. Bancorp and Truist are among the better performers, with declines of 180 basis points (ranked 8th) and 230 basis points (ranked 10th), respectively. To give you an idea of the range, Deutsche Bank USA (DB) was by far the worst performer, with a decline of 870 basis points from the unstressed level, and Bank of New York Mellon (BK) saw its CET1 ratio increase by 150 basis points under stress.
Figure 3: Truist Financial Corp. (TFC) and U.S. Bancorp (USB): Stressed CET1 ratio, compared to selected peers and the median of 23 banks (own work, based on data from the Dodd-Frank Act Stress Tests 2023 results)
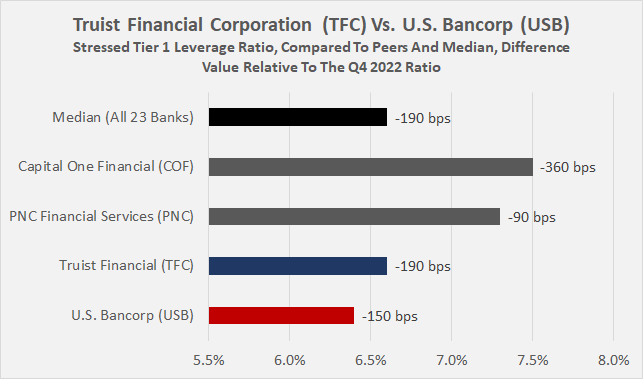
In terms of tier 1 leverage ratio (Figure 4), Truist and U.S. Bancorp also performed comparatively poorly, but still adequate and significantly better than, for example, Citigroup (stressed leverage ratio of 5.0%), which is after all a G-SIB. In relative terms, I do not consider the 190 basis point and 150 basis point increases in the leverage ratio to be a cause for concern.
Figure 4: Truist Financial Corp. (TFC) and U.S. Bancorp (USB): Stressed tier 1 leverage ratio, compared to selected peers and the median of 23 banks (own work, based on data from the Dodd-Frank Act Stress Tests 2023 results)
Of the four banks, Capital One ($455 billion total assets at year-end 2022) performed significantly worse in terms of both CET1 ratio decline (450 basis points) and tier 1 leverage ratio (360 basis points increase). The Virginia-based bank’s portfolio specializes in credit cards, auto loans, and commercial products (p. 81, COF 2022 10-K). In 2022, COF generated 75% of its total net income before noninterest expenses, but after provision for loan losses, from loans or investments. However, the bank is quite conservatively leveraged overall (likely due to the inherently riskier portfolio and concentration risk).
In contrast, U.S. Bancorp is very well diversified beyond its loan portfolio through its exposure to mortgage banking, wealth management, custodian services, and payment services, which together accounted for nearly 43% of total income before noninterest expenses and after loss provisions in 2022. Truist generated almost 40% of its total income in 2022 outside of its lending and investment lines, with the insurance business being particularly noteworthy with a share of almost 14%. It should be noted, however, that the bank announced the sale of a 20% stake in February. Even though insurance revenues will decline accordingly, the implied valuation of the entire insurance division of $14.8 billion (based on the sale at an adjusted 27x earnings multiple) is definitely very attractive in my opinion.
When looking at the tier 1 capital ratio (equity capital and disclosed reserves) and taking into account off-balance sheet exposure via the supplementary leverage ratio (SLR, e.g., cleared derivatives or repo-like transactions), Truist and U.S. Bancorp look pretty good. Their tier 1 capital ratios declined much less than the median, but their supplementary leverage increased much more than the median. However, the still fairly modest increase does not indicate poorly positioned derivatives exposure at either bank (Figure 5). In general, I think comparing a bank’s individual SLR with the median is problematic because business models, and hence the derivatives book structure and size, can differ significantly. In this context, the 420 basis point increase in SLR at Deutsche Bank USA is worth noting in light of its huge derivatives exposure. As an aside, the SLR is not calculated for Category IV banks, which also is likely to affect comparability (median based on 19 out of 23 banks).
Figure 5: Truist Financial Corp. (TFC) and U.S. Bancorp (USB): Stressed tier 1 leverage ratio, compared to selected peers and the median of 23 banks (own work, based on data from the Dodd-Frank Act Stress Tests 2023 results)
The stress tests include an analysis of the impact on net income before taxes. Under the severely adverse stress scenario, the 23 banks are projected to experience a decline in net income totaling $190 billion, or 1% of average total assets. In this context, U.S. Bancorp and Truist perform acceptably well, with declines of $5.5 billion and $9.5 billion, respectively, or about -0.8% and -1.7%, compared to the median -1.2% of average assets for all 23 banks. As expected, U.S. Bancorp fared better due to its stronger diversification (recall how well USB navigated 2008/09). However, comparing the projected losses to the average pre-tax net income for 2020 to 2022 ($7.8 billion and $7.0 billion, respectively), these numbers are obviously significant, and the banks would almost certainly be barred from paying dividends in a severe recession. The losses are largely attributable to loan loss provisions ($23.3 billion and $20.3 billion, respectively). At 6.0% and 6.2% of total gross loans and leases at year-end 2022, the provisions are undoubtedly significant. As can be expected, close peer PNC Financial performed slightly better at 5.3%, while Capital One quite badly at 14.6%. I would argue that TFC’s and USB’s loan and lease loss provisions under the severely adverse scenario, while definitely significant, are still very much in line with the median, and G-SIBs like Citigroup and Wells also would likely report loan loss provisions of about 6% of their respective current loan portfolios.
Finally, in reviewing Table 9 of the stress test report (found on p. 19 of the PDF), I did not identify any particular concentration risks in projected credit losses for either Truist or U.S. Bancorp. It’s also worth noting that projected losses in their available-for-sale (AFS) and held-to-maturity portfolios are expected to remain insignificant ($0.9 billion and $0.0 billion, p. 45 and p. 47, respectively).
Conclusion
Are TFC And USB Stock Still A Buy And What Can We Expect From The Fed Going Forward?
Some may argue that the results of the Dodd-Frank Act Stress Tests 2023 are not meaningful because the severe adversary scenario lacks nationwide bank runs. However, as pointed out in the article, the expectation of such severe bank runs, and taking into account that our banks operate on a fractional reserve system, is a knockout argument that precludes the possibility of constructive discussion.
Capitalization of banks has improved significantly since the Great Recession, and the Federal Reserve’s actions in response to the SVB collapse and related events confirm that it places great emphasis on ensuring financial stability and confidence in the banking system – the single most important aspect, in my view.
The article discussed the key inputs to the severely adverse stress scenario and concluded that the scenario adequately reflects a severe global recession with widespread contagion effects, which is definitely not currently priced into bank (and other equity) valuations.
While Truist and U.S. Bancorp performed rather poorly on the surface, the severely adverse scenario for these two relatively large banks is nevertheless manageable. Compared to smaller Capital One, TFC and USB were significantly less affected, while similarly sized PNC Financial fared better on all metrics examined. Nevertheless, as a shareholder of TFC and USB, I appreciate the diversified portfolio of the two banks and adequate loss-absorbing capacity. Their loan loss provisions are high in absolute terms, but in line with other banks and also G-SIBs like Citigroup or Wells Fargo, but worse than BAC, which could even free up some of its (more than adequate) internal regulatory capital. All in all, it’s reasonable to expect higher stressed capital buffers for TFC and USB (and of course COF). However, due to COF’s unstressed CET1 ratio at the end of 2022 having been quite high (12.5% versus 9.0% for TFC and 8.4% for USB), this does not mean that either company will need to increase their respective internal capital ratio. The Federal Reserve is expected to announce the individual capital requirements in August.
Based on what I consider to be reasonably positive results, and because I maintain my view that fears about TFC and USB’s unrealized HTM portfolio losses are overblown, I still believe the shares are worth buying, although I acknowledge that the profitability of Truist and U.S. Bancorp will almost certainly be negatively impacted in the future. Truist stock currently trades at a blended price-to-earnings ratio of 7.2 and a dividend yield of 6.8%, while U.S. Bancorp stock trades at 8.3 times earnings and a dividend yield of 5.9%. My positions in the two stocks are still quite small, and I don’t plan on going overly aggressive (I limit them each to no more than 0.75% of total portfolio value), but I do expect to buy a few additional shares today or Monday.
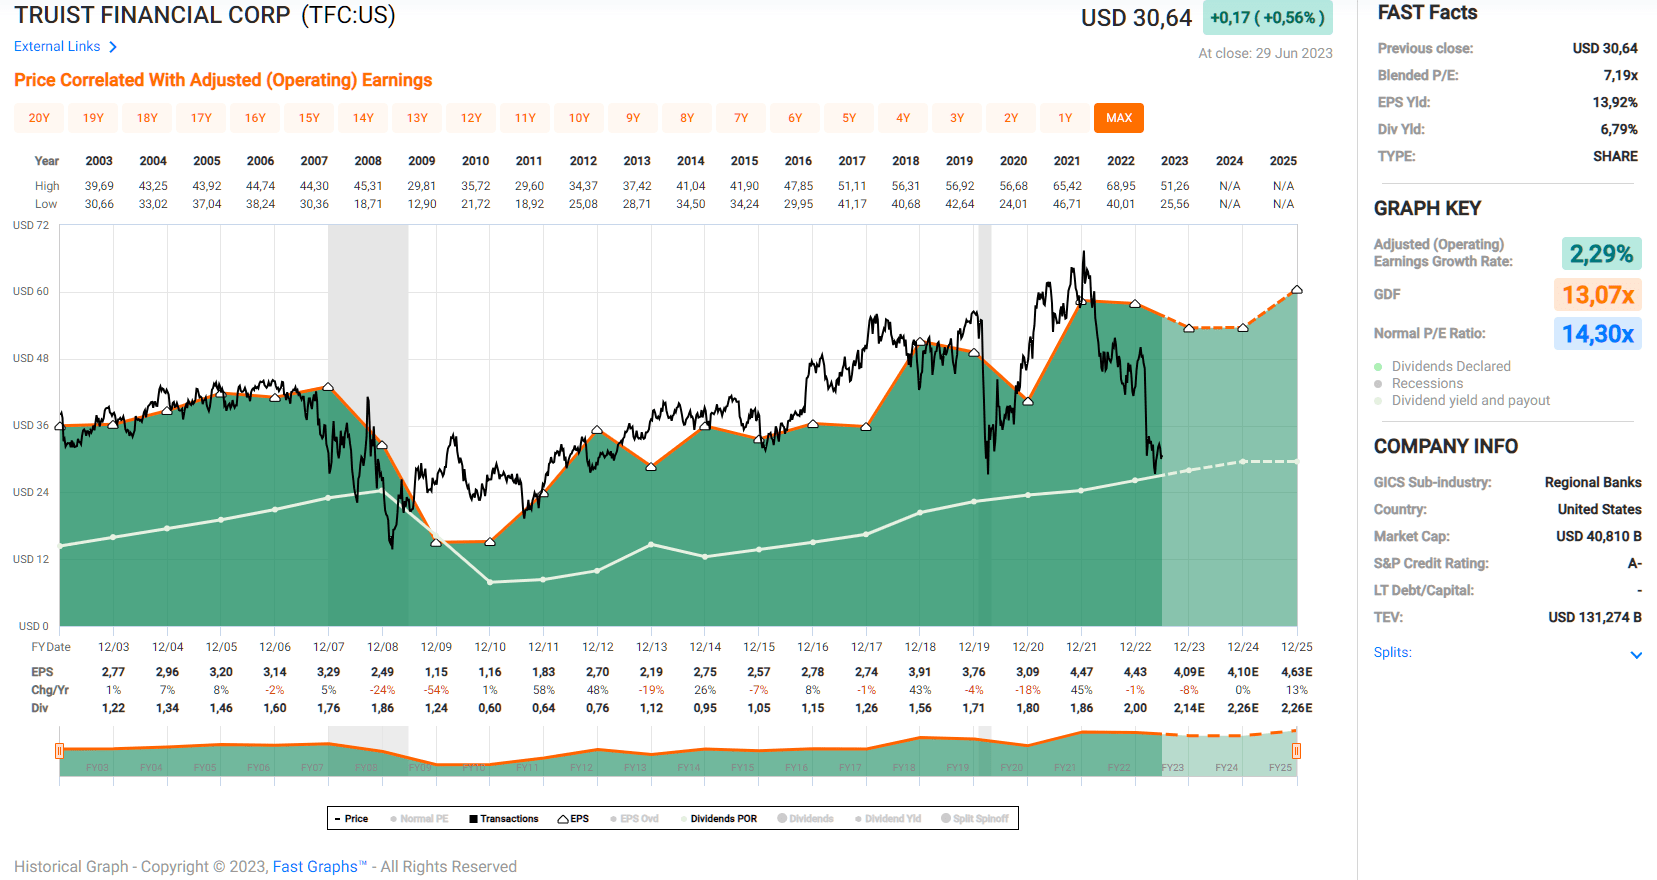
Figure 6: Truist Financial Corp. (TFC): FAST Graphs chart, based on adjusted operating earnings per share (FAST Graphs tool)
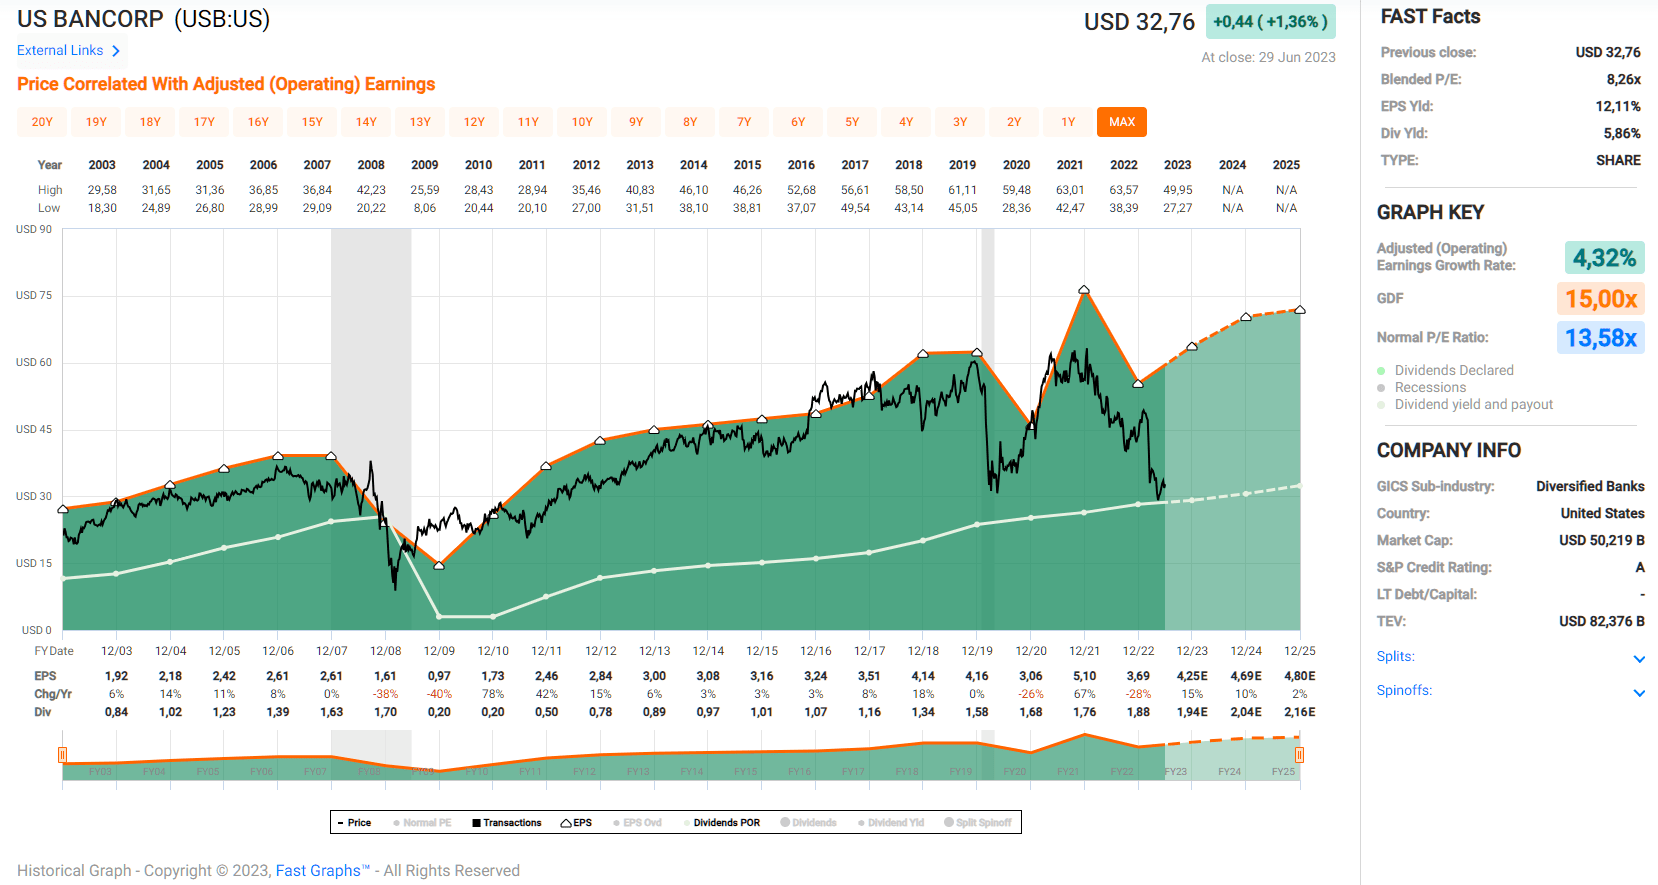
Figure 7: U.S. Bancorp (USB): FAST Graphs chart, based on adjusted operating earnings per share (FAST Graphs tool)
As always, please consider this article only as a first step in your own due diligence. Thank you for taking the time to read my latest article. Whether you agree or disagree with my conclusions, I always welcome your opinion and feedback in the comments below. And if there’s anything I should improve or expand on in future articles, drop me a line as well.
Editor’s Note: This article discusses one or more securities that do not trade on a major U.S. exchange. Please be aware of the risks associated with these stocks.
Source: seekingalpha.com


