
For investors using technical analysis to find possible opportunities, the search usually starts with a methodical screen. One frequent method looks for stocks that are both showing technical health and creating a constructive price pattern, a pairing that can point to a possible breakout. This method generally uses two main measures: a technical score to judge the overall condition and trend of a stock, and a setup quality score to evaluate if the price action is consolidating in a manner that provides a clear, low-risk entry point. A high technical score implies the stock is in a lasting uptrend, while a high setup score shows it is pausing or tightening, possibly getting ready for its next move upward.
U.S. Bancorp (NYSE:USB), a large national banking company, is currently listed on such a breakout screen. According to the newest ChartMill technical report, the stock shows an interesting profile for traders concentrating on momentum and pattern recognition.
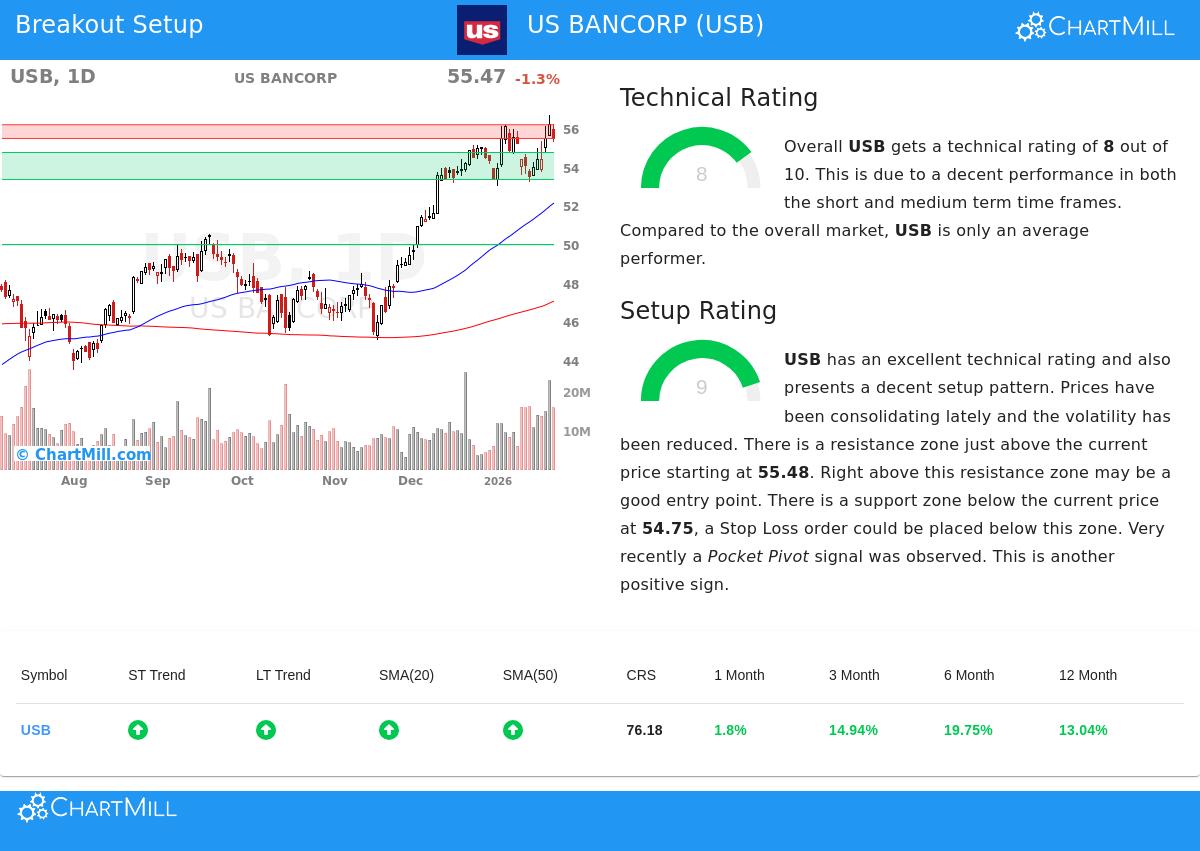
Technical Strength: A Firm Base
The first part of a breakout setup is a firm basic trend. A stock needs to show technical health to support the idea that a breakout will result in more gains instead of failing. U.S. Bancorp’s technical picture gives this base.
The stock receives a firm Technical Rating of 8 out of 10, which places it as being in a verified uptrend. This number is backed by several important notes from the report:
- Positive Trends: Both the long-term and short-term trends for USB are scored as positive, showing aligned momentum across various time frames.
- Moving Average Support: The stock is priced above all its main simple moving averages (20, 50, 100, and 200-day), and each of these averages is itself in a rising pattern. This layered alignment of support levels is a standard trait of a good uptrend.
- Strong Relative Performance: Over the last year, USB has done better than 76% of all stocks in the market. While the report mentions this health is partially because of a recent firm move, it still puts the stock in a leading spot.
This mix of elements means USB is not just moving upward without reason; it is doing so with the support of technical proof behind it. For a breakout method, this basic health is important because it raises the chance that a move above resistance will continue.
Setup Quality: The Pattern for a Possible Breakout
A firm trend by itself is not a sign to buy; entering a stock that has already made a big, extended move can be risky. This is where the setup quality score becomes important. It finds times of consolidation or “tight” price action inside the larger uptrend, which can provide a better-probability entry. U.S. Bancorp does well here too, having a very good Setup Rating of 9.
The technical report explains why the present price action is constructive:
- Consolidation in a Range: Over the last month, USB has been trading between $52.99 and $56.70. It is now trading near the top of this range, implying it is testing the upper limit of its recent consolidation.
- Defined Support and Resistance: The analysis finds a clear support area between $53.35 and $54.75, made by a combination of moving averages and trendlines. Just above the present price lies a set resistance area between $55.48 and $56.19.
- Lower Volatility & Positive Signs: The report mentions “lower volatility while prices have been consolidating,” which often comes before a directional move. Also, a recent “Pocket Pivot” sign, a volume-backed price move showing accumulation, was seen, adding a positive factor to the setup.
This high-quality setup directly answers the “when” to buy. The consolidation has made a clear level to watch for a breakout (above $56.19) and a close level to control risk (below the support area). This structure allows for a planned trade with a set entry and exit.
A Specific Trading Example
Based on this analysis, the technical report describes a sample breakout trade. It proposes a possible entry on a buy-stop order at $56.20, which is just above the noted resistance area. A stop-loss order could be set at $53.34, below the support area, capping the possible loss on the trade to about 5.1%. This example shows how the technical and setup scores turn into a workable plan with managed risk.
It is very important to recall that this created setup is a descriptive example based only on technical measures. Investors must always do their own research, thinking about basic elements like coming earnings reports (planned for April 17th) and wider sector conditions before committing funds.
Finding More Possible Breakout Setups
U.S. Bancorp is only one example found by a methodical screen for stocks with high technical and setup scores. Market situations shift each day, and new patterns are always developing. To see an updated list of possible technical breakout chances, you can check the newest results using the Technical Breakout Setups screen.
Disclaimer: This article is for information only and does not make up investment advice, a suggestion, or an offer to buy or sell any security. The analysis is based on technical data and automated reports. All investments carry risk, including the possible loss of principal. Past results are not a guide for future results. You should do your own investigation and talk with a qualified financial advisor before making any investment choices.
Source: chartmill.com